The Art of Visualization
Goals of VisualizationVisualization is a form of digital storytelling and depending on the goals, different techniques are utilized. These goals could include:
- Discover trends and relationships between the data
- Find patterns
- Answer questions
- Make decisions
- Tell a story or present an argument
- Support graphical calculation
- Expand memory
- Inspire
A common visualization is a dashboard, which of course was inspired by the physical dashboards in automobiles. One well-known virtual example is the dashboard in Google Analytics:
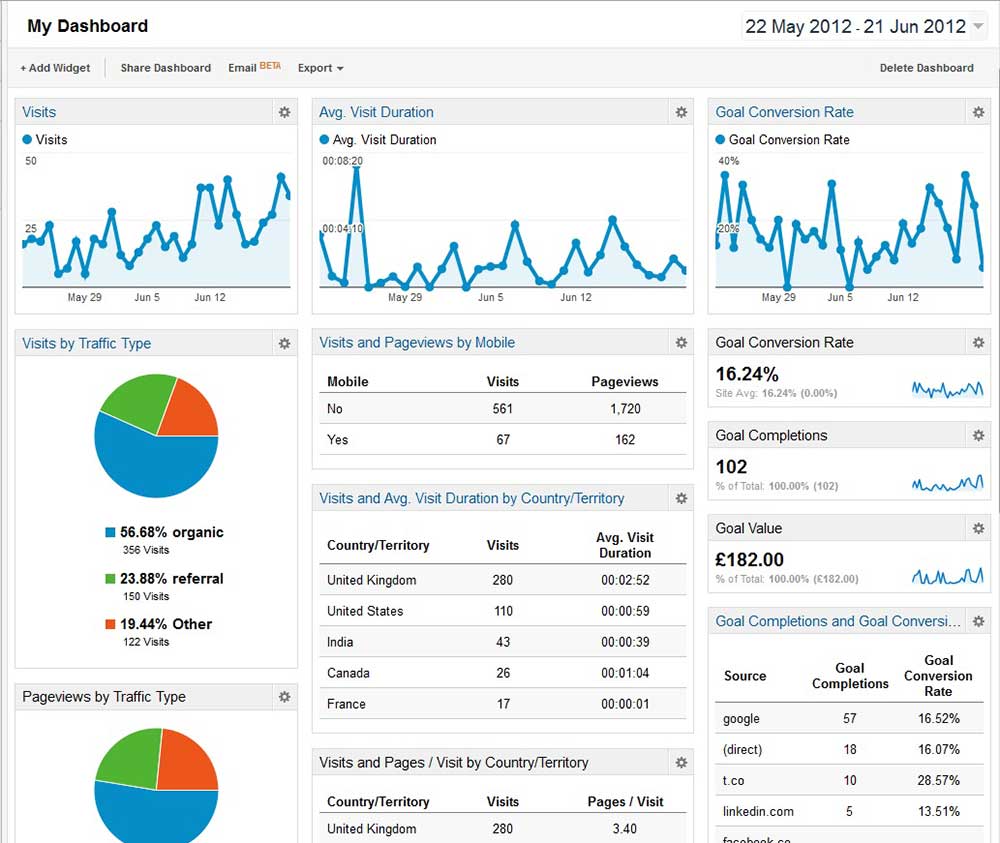
Google Analytics Dashboard
The Google Analytics dashboard presents information visually with a goal to help website managers to draw conclusions about the traffic of their websites. It shows among other things the ebb and flow of a website’s traffic, its sources, geographic origins and user browsers.
A dashboard is a powerful way to visualize data that is gathered regularly and for which there is an understanding of the implications of certain patterns. For instance, the saw-tooth wave pattern at the top of the Google Analytics dashboard is cyclical; an event that interrupts that pattern could be cause for concern. That said, some visualizations are better for other purposes. The skill of the data visualization engineer is to understand the overarching intent and to select the ideal visualization to achieve the goal.
Until just a few years ago, most visualizations were necessarily static. One of the most famous is Joseph Minard’s 1869 visualization of Napoleon’s Grande Armée’s 1812 march into Russia and its subsequent retreat. This pre-computer visualization dramatically shows in two dimensions six independent variables and tells a gripping story of hubris, loss of life, suffering and catastrophe. In a way, all visualization engineers aspire to emulate such a great of feat of storytelling with data.
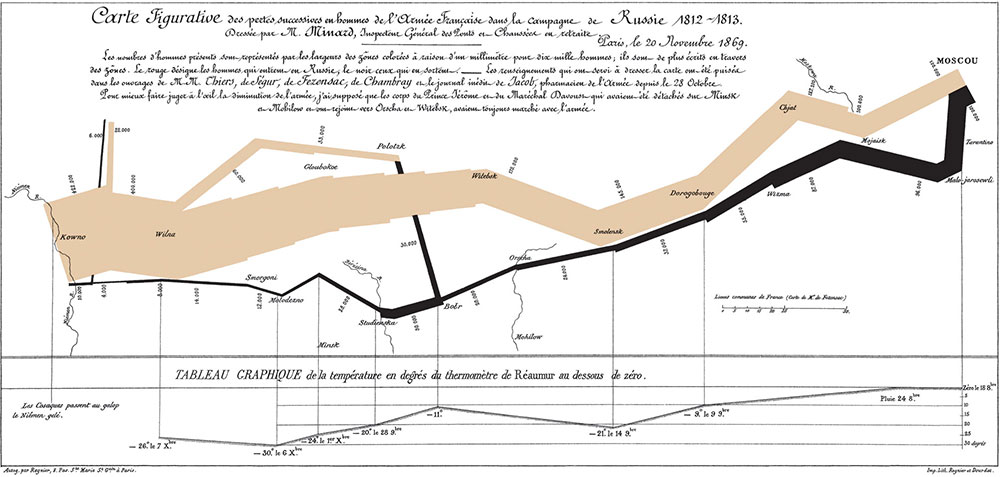
Minard’s Visualization of Napoleon’s Invasion of Russia.
With the advent of computers, we were no longer constrained to paper or static visualizations. And, the art of digital storytelling with data has moved forward by leaps and bounds. Beginning just a short time ago at the end of the 20th Century, we went from charts and graphs in applications like Microsoft Excel, to query-driven web pages that displayed static (but easily updatable) reports and charts by the mid-2000’s. An early example of such online reports was the complex, option-ridden user interface to the CDC’s Wonder application.
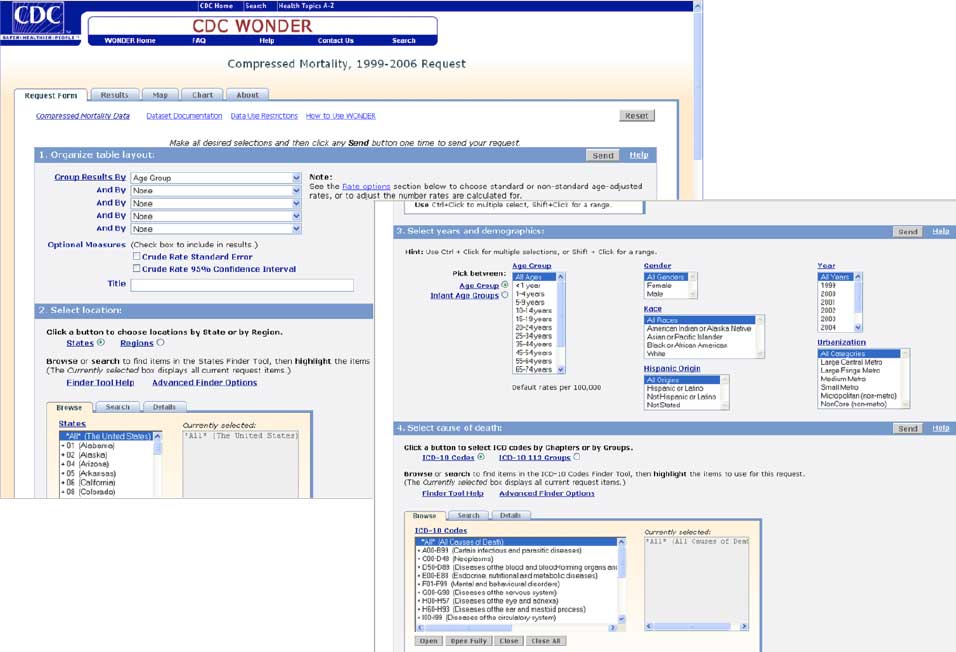
CDC Wonder Query Selection
Today, such a query-driven application seems less intuitive or useful than Minard’s. Indeed the years from 2007 to the present have seen a burst of creativity and technology that has transformed the visualization of data. And, just in time, as the explosion of data has made traditional ways of managing it infeasible. Technology from Stanford University, MIT and the University of Washington, among others are making open source libraries available to knowledgeable and skilled practitioners. Companies such as Tableau and JavaScript libraries such as D3.js emerged from the work at Stanford.
Interactive visualizations are also becoming popular thanks to the work of TheNew York Times, The Guardian, The Washington Post and Bloomberg, among others. These news outlets are publishing fully interactive visualizations to convey stories in very engaging ways.
Soon all organizations that handle data, even not necessarily large repositories of data, will be expected to engage their consumers using intuitive visualizations that communicate the essence of information quickly and accurately.
Looi Consulting helped us develop tools to better present the data we had been collecting for years. In just a few months, they designed and delivered a solution that yielded new insights and allowed us to view the data in ways we couldn’t before. The visualizations they designed have led to new ideas both in presenting our data and for the data products we offer.