Insights from Legacy Data
The IDB wanted to use new technologies to get more value from its data assetsThe Challenge
The Inter-American Development Bank (IDB) has an information system for trade data that was built over the past 20 or more years. It was designed to serve the information needs of policy makers, analysts and business owners in the Latin American and Caribbean region. However, the queries were slow and the results, tables and charts were static and did not allow the users to engage with the data in an immersive way.
With the launch of the ConnectAmericas portal for SMBs in the region, the IDB wanted to develop a more interactive and useful system with the purpose of allowing SMBs to explore bilateral trade data, import tariffs and preferential tariffs on the region to support their decision making process. Earlier Looi Consulting had ETLed the legacy data into a much more high performing Data Warehouse. However, the data still could not be easily used by practitioners or business people. More was needed to liberate the data from its confines.
The Solution
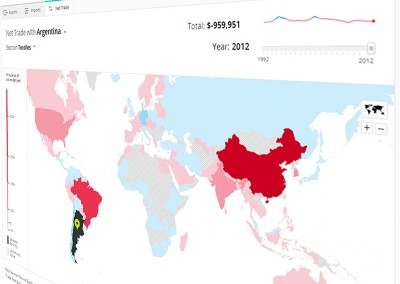
The IDB engaged Looi Consulting to develop state of the art interactive visualizations. One of them, a map visualization of bilateral trade data by country and year and by different product groupings, allows users to easily explore and interact with extremely large data sets without being overwhelmed with a complex UI. It also supports a tabular view that shows the top ten export and import destinations and the top ten largest partners of the selected country from the Latin America and Caribbean (LAC) region.
Another interactive report allows users to explore tariffs (a.k.a. import taxes) and Preferential bilateral Tariffs with ease. The bilateral trade visualizations are interconnected with the tariff reports, permitting users to explore exports from a given country to other countries to check tariff data of importing countries. The usefulness of these visualizations is further enhanced by the user’s ability to drill down to selected products.
Capabilities
The solution developed by Looi Consulting demonstrated our capabilities in:
- Data Consulting: Analyzed data sets and business use cases.
- Data System Development: Built web services to serve up the data for the front end resulting in an optimized download strategy for large data sets.
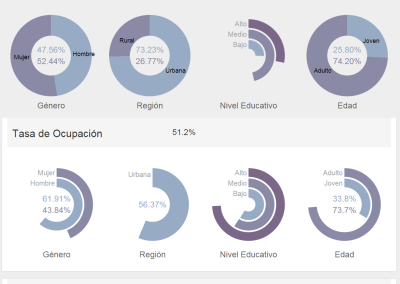
- BI Development: Designed a visualization and report to show BI insights.
- BI Tool and Application Architecture: Refined Visualization tools to handle scale and other artifacts inherent in the data.
- BI Dashboarding: Designed and built easy-to-understand dashboards.
Timeframe
The design and development unfolded over a period of 5 months as the IDB was engaged through an iterative, consultative process of agile development. This approach had the advantage of involving the stakeholders in design and implementation decisions from the outset, yielding higher overall customer satisfaction.
%
Performance Improvement
%
Workflow Step Reduction
Intuitive UI
Streamlined Workflow
Productivity Increased 500%
Workflow Streamlined
Performance Improvement
More Natural Information Workflow
Intuitive UI
- Query Performance 12000%
- Workflow Steps 15%
Impressive Results
The new visualizations and reports have been incorporated into the IDB’s ConnectAmericas portal, for which Looi Consulting has been a key strategic consultant. These visualizations are fully portable onto other websites as well.